Date: 16.3.1999
Janne Viljas, 44468K
Session 4, Chapter 9 of Cooper
Exercise 9.2.1 / 9.2.2
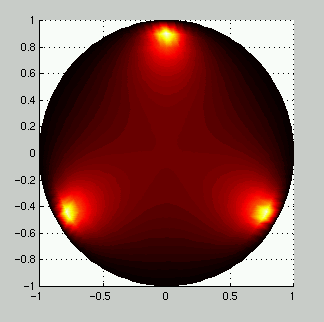
The Matlab code used to generate the image below is here. The image shows a plot of the sum of three Poisson
kernels on the boundary of the unit disc. The lattice spacing was 0.05 in
the r-direction and 0.01 in the polar angle.

Here is also another image, where the
lattice density is a bit higher.
Exercise 9.2.3
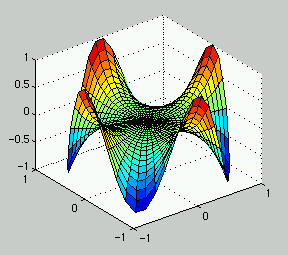
The Matlab code is here. The image plotted with it
shows the harmonic r^n*cos(n*theta) with n=4.

Exercise 9.2.4 (b)
The Cooper code 'dirch.m' was neede here. It and the boundary function can
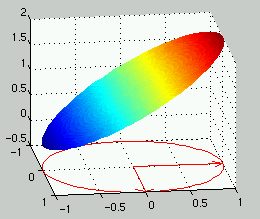
be found here. Shown below is the
rather dull numerical solution resulting from the boundary function
fun(th)=1+sin(th). The maxima and minima are, of course, obtained on the
boundary and only there. Clearly they are 2 and 0.

Exercise 9.2.5
The same as before.
The boundary function is here.
The maxima and minima on the boundary can be found numerically, using
Matlab (optimization toolbox) function 'fminu' or something else.
The minimum is fun(-0.8640)=1.0256 and the maximum
fun(3.1139)=4.1069.

Exercise 9.2.6
The same thing again. The boundary function is here.
The extrema are +-4 at +-pi/2. And the plot is here.

Exercise 9.2.7
And still once more. The boundary function is here.
Maximum is fun(3.0909)=0.9818 and minimum fun(4.7335)=-2.9180.
The value at the origin is u(0,0)=-0.3158.
And the plot is below.

Exercise 9.2.8
Pen & paper.
Exercise 9.2.9
Pen & paper.
Exercise 7
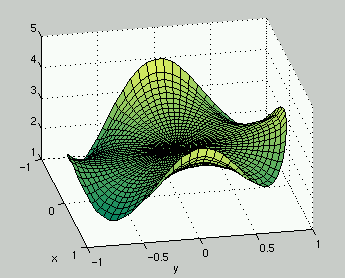
This image was obtained directly from the Poisson's formula using
numerical integration. The boundary condition was as in Ex. 9.2.5. so the
surface looks about the same as there. The m-files are, of course,
here.


