Contents
mlNl010R.m Funktion nollakohdat
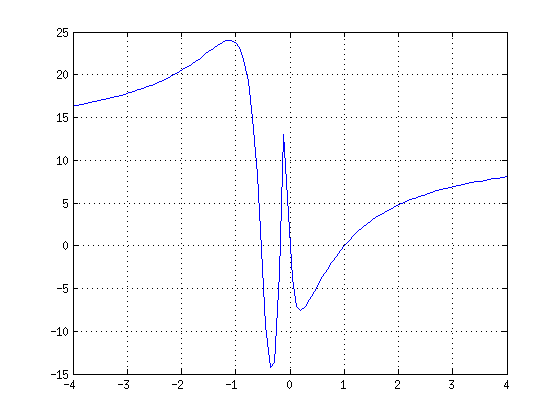
close all
format
f=@(x)12*(x-1).*sin(x./(x.^2+0.4*x+.1))
x=linspace(-4,4);
plot(x,f(x)); grid on;shg
figure
x=linspace(-1,1,1000);
plot(x,f(x)); grid on;shg
f =

    @(x)12*(x-1).*sin(x./(x.^2+0.4*x+.1))
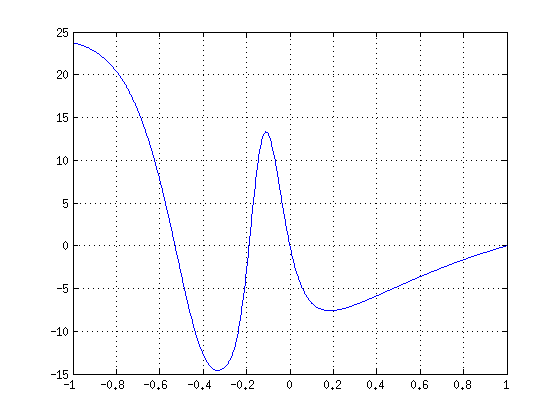
Alkupisteet kuvasta: -0.5, -0.2, 0, 1 (2 viimeista suoraan lausekkeesta)
x1=fzero(f,-0.5)
x1 =

   -0.5294
x2=fzero(f,-0.2)
x2 =

   -0.1889
x3=fzero(f,0)
x3 =

     0
x4=fzero(f,1)
x4 =

     1
Lisätään nollakohtarinkulat kuvaan:
hold on
plot([x1 x2 x3 x4],0,'or')
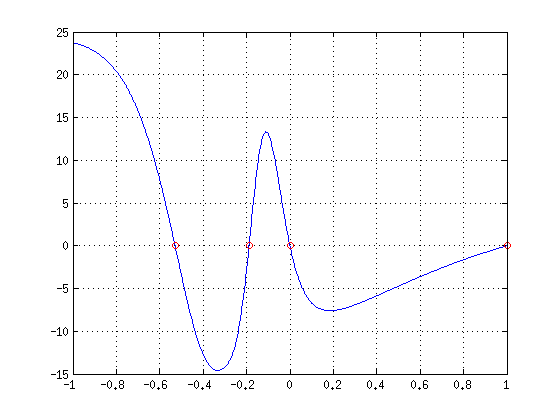
Onko tässä kaikki?
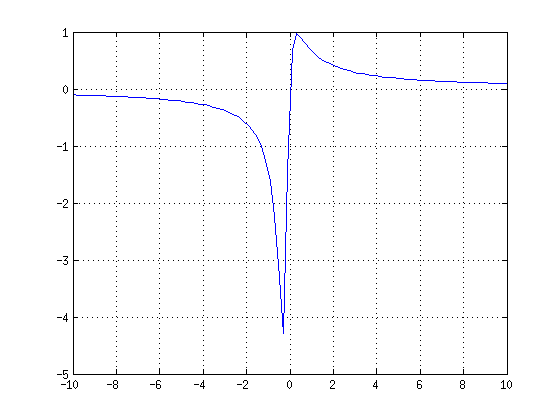
hold off
x=linspace(-10,10);
plot(x,x./(x.^2+0.4*x+.1))
grid on
shg
figure
x=linspace(-1,0);
plot(x,x./(x.^2+0.4*x+.1))
grid on
shg
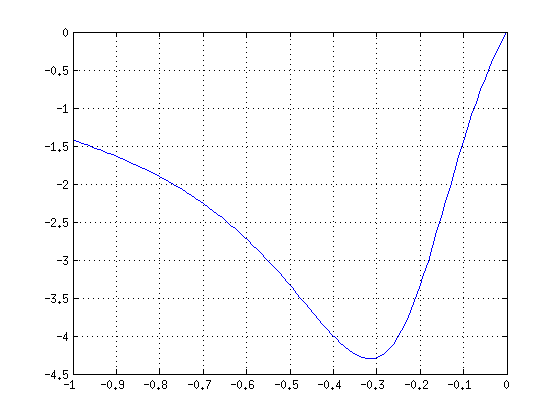
Sini ei voi saada arvoa 0, kun x < -1 (tällöin sinin argumentti välillä (-3,0)), eikä arvoilla x > 0. Niinpä muita ei ole.