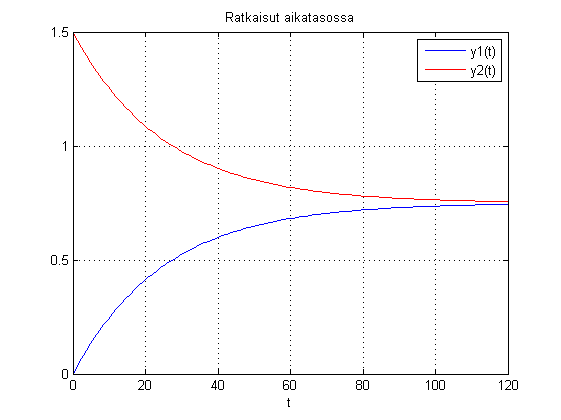
t=linspace(0,120);  % 2 tuntia, sataan osaan diskretoitu.
y1=0.75*(1-exp(-0.04*t));
y2=0.75*(1+exp(-0.04*t));
plot(t,y1,'b',t,y2,'r'); grid on
title('Ratkaisut aikatasossa')
xlabel('t')% ,ylabel('y1,y2')
legend('y1(t)','y2(t)')
|

|
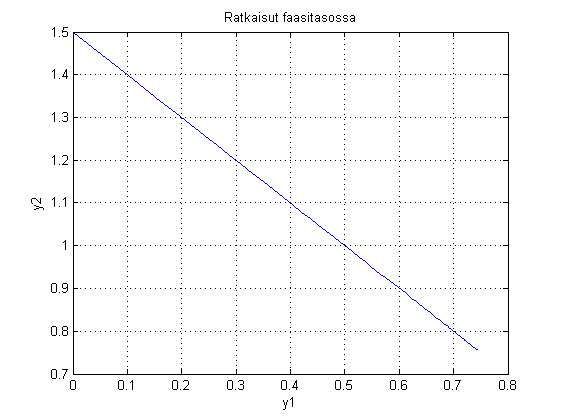
figure
plot(y1,y2)
grid on
title('Ratkaisut faasitasossa')
xlabel('y1');ylabel('y2')
taulukko=[t' y1' y2'];
taulukko(1:10,:)
    ans =
%%%%     t       y1       y2
%%%%%%%%%%%%%%%%%%%%%%%%%%%%%%%%%
         0         0    1.5000
    1.2121    0.0355    1.4645
    2.4242    0.0693    1.4307
    3.6364    0.1015    1.3985
    4.8485    0.1322    1.3678
    6.0606    0.1615    1.3385
    7.2727    0.1893    1.3107
    8.4848    0.2158    1.2842
    9.6970    0.2411    1.2589
   10.9091    0.2652    1.2348
|

|